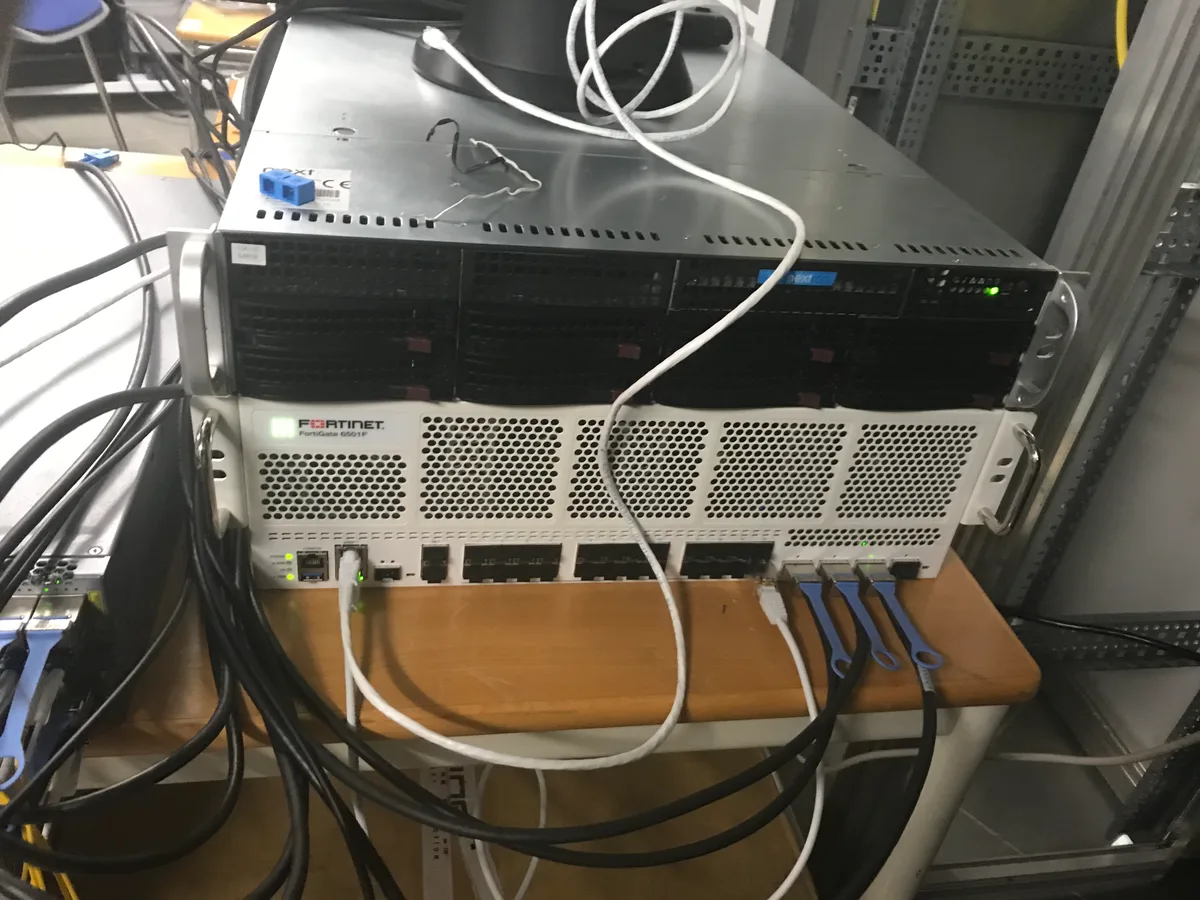
When FortiGate CPU stays above 90%, you risk packet loss, VPN drops, and Conserve Mode. Even with ASIC acceleration, UTM profiles, heavy SSL inspection, stuck daemons, or unfiltered debug sessions can spike CPU.
This guide covers FortiOS 7.6 CLI diagnostics (get system performance status, diagnose sys top) and step-by-step fixes. Use SSH when the GUI is slow — unfiltered debug commands raise CPU further; run only what you need during troubleshooting.
Primary Causes of FortiGate High CPU Issues
There is no single cause for high CPU usage on FortiGate; the issue usually stems from software processes, unusual network traffic patterns, or configuration errors. The most common causes are:
- Intense Security Profiles (UTM Engine): Uncontrolled activation of processor-intensive security profiles such as Deep SSL Inspection, Antivirus, IPS (Intrusion Prevention System), and Web Filtering on all traffic can overload the CPU.
- Software Bugs and Crashes (Daemon Crash): Unstable versions of the FortiOS operating system or locked/memory-leaking background services (e.g.,
ipsmonitor,wad,scanunitd) can push CPU usage to 100%. - SSL VPN and IPsec VPN Intensity: High-volume data transfers by many users simultaneously over encrypted VPN tunnels strain CPU limits, especially on entry-level models with limited hardware encryption support.
- Cyber Attacks and DDoS: Intense DDoS (Distributed Denial of Service) attacks or port scans targeting your network consume CPU resources as the firewall attempts to analyze these packets.
- Heavy Logging and Reporting: Intensive and unfiltered log writing to disk or memory creates additional overhead for logging services on the CPU.
How to Diagnose FortiGate CPU via CLI Commands
The FortiGate web interface (GUI) may become unresponsive or slow during high CPU states. Therefore, CLI (SSH) connection is always preferred for diagnostics and analysis. Once connected to the device via SSH, you can use the following commands to identify the source of the problem:
1. Viewing Instant CPU and System Performance
For instantaneous CPU, memory, and session status on FortiOS 7.6, start with:
get system performance status
This shows CPU percentage, memory usage, and active sessions in one view. Use get system status for FortiOS version, uptime, and license details.
2. Listing CPU Usage of Processes
To identify which daemon is consuming CPU, use the FortiOS 7.6 diagnostic command:
diagnose sys top
- Output Analysis: CPU and memory percentages appear at the top; running services (PID, Process Name, CPU%, MEM%) are listed below. If
ipsmonitororwad(Web Application Daemon) ranks high, the issue likely stems from IPS or Web Filtering. - Exit: Press
qto leave the screen. - Warning: Unfiltered
diagnose debugor broad debug commands temporarily raise CPU. When finished, rundiagnose debug disableanddiagnose debug reset.
3. Checking Hardware Acceleration (ASIC) Status
To check how much of the traffic is handled by hardware chips (NP/CP):
diagnose sys session list
If traffic cannot be hardware-accelerated and lands directly on the main CPU (CPU 0), this leads to high CPU usage.
Step-by-Step FortiGate High CPU Resolution Methods
Following the diagnostics steps, you can apply the following resolution steps based on the source of the issue:
1. Restarting Unresponsive Services (Daemons)
If diagnose sys top shows a service like wad or ipsmonitor locked and consuming high CPU, you can safely restart that service.
- Restarting WAD (Web Filtering) Service:
diagnose test application wad 99 - Restarting IPS (Intrusion Prevention) Service:
diagnose test application ipsmonitor 99
Note: These commands stop and automatically restart the respective services in the background. A very brief disruption in traffic may occur, but it is generally a much safer and faster solution than rebooting the device entirely.
2. Optimizing SSL Inspection Policies
Instead of applying "Deep SSL Inspection" to all internet traffic, exempt trusted categories (banking, healthcare, government sites, etc.) from this inspection. This process significantly reduces the decryption load on the CPU.
3. Adjusting Logging Level and Frequency
Instead of logging every packet transition, log only necessary events. Forward logs to an external log analyzer instead of writing them to the device's own disk or memory. For professional analysis and reporting on this matter, you can establish our Network Security, Firewall and IDS/IPS Solutions infrastructure and store your logs in compliance with legal standards.
Additionally, to protect the overall health of your cybersecurity infrastructure and manage your firewall and EDR solutions centrally, you can benefit from our Firewall, EDR and Antivirus Management Solutions services.
To professionally plan your business's network security policies, IT investments, and technology roadmap, you can work with our expert team within the scope of our Business and Management Consulting services.
You can also review our other guides that will strengthen your cybersecurity and network infrastructure:
- To establish a secure remote access infrastructure: FortiGate IPSec VPN Deployment
- For legal internet logging obligations: What is 5651 Logging, and for Whom is it Mandatory?
- For SIEM, Syslog, and 5651 architectures: SIEM, Syslog, and 5651 Correct Architecture Design
- For KVKK compliance of your server infrastructure: Dell Server KVKK Technical Measures Guide
- For ISO 27001 logging requirements in the virtualization layer: How to Configure VMware Logging for ISO 27001?
- For KVKK compliant logging in virtual environments: How to Configure VMware Logging for KVKK?
- For secure destruction of personal data: Obligations of Deletion, Destruction, and Anonymization in KVKK
- For compliance of physical security and camera recordings: Camera Systems Within the Scope of KVKK
- For compliance processes of small-scale businesses: Small Business Guide for KVKK
- For integration of KVKK and ISO 27001 standards: KVKK and ISO 27001 Integration
- For the foundation of information security standards: What is ISO 27001?
To resolve performance issues on your FortiGate firewall devices, troubleshoot high CPU/memory problems, and optimize your network security infrastructure, you can contact us at any time.
Frequently Asked Questions
Does internet access drop when CPU usage is 100% on FortiGate?
It may not always drop entirely, but severe packet losses and slowdowns occur. To protect the CPU, FortiGate enters "Conserve Mode" in some situations. In this mode, the device may reject new sessions, disable certain security scans, or block traffic directly. This causes users to be unable to access the internet or drops VPN connections.
Does upgrading the FortiOS firmware version resolve high CPU issues?
Yes, it can. In some versions of the FortiOS operating system, known software bugs (service crashes, memory leaks) can directly cause high CPU usage. Reviewing the Release Notes published by Fortinet and upgrading to a stable release where bugs in your current version are resolved can permanently solve the problem.
How does FortiGate hardware acceleration (ASIC) affect CPU load?
Special ASIC chips such as NP (Network Processor) and CP (Content Processor) in FortiGate devices process firewall rules, NAT, encryption (VPN), and some UTM scans at the hardware level without placing a load on the main CPU. If there are configurations in your rules that prevent hardware acceleration (e.g., incompatible encryption algorithms or certain proxy-based UTM features), traffic is processed directly by the main CPU, which rapidly increases CPU usage.
Conclusion
High CPU usage (High CPU) on FortiGate firewall devices is a performance problem that directly threatens network operations but can be resolved quickly with correct diagnostics steps. Identifying locked services via CLI analysis, optimizing UTM profiles, adjusting SSL inspection policies, and using a stable FortiOS version will maximize your device's performance. A secure, uninterrupted, and high-performance network infrastructure secures your corporate data while guaranteeing your business continuity.