Network and System Monitoring Platform Integration
We unify network and system events in one monitoring control plane for stronger IT operations visibility.

Operational Outcomes You Gain
We improve infrastructure observability and response speed.
Network devices, servers and critical services are monitored in one platform.
Threshold and correlation logic prioritize actionable incidents.
Outage risk signals are detected earlier to reduce service impact.
How We Work
Monitoring integration follows discovery, source onboarding, alert design and tuning phases.
Critical assets and target infrastructure metrics are defined.
Agents, SNMP and API data sources are onboarded to the monitoring platform.
Operational dashboards and alert priority models are configured.
False positives are reduced and response KPIs are continuously improved.
Monitoring Operations Metrics
We measure impact through alert quality, visibility depth and incident response speed.
Critical infrastructure telemetry is consolidated in one view.
Alert tuning lowers noise and improves operations focus.
Prioritized incident flows reduce response latency.
Critical network and system events are tracked continuously.
Frequently Asked Questions
Yes. Existing tools can be integrated depending on architecture and data access.
No. Correlation and threshold design focus on actionable alerts only.
Yes. Dashboards can be tailored for NOC, system and executive stakeholders.
Yes. Daily, weekly and monthly reporting schedules can be configured.
Related ManageEngine Services
Complete monitoring with ITSM, identity automation and application performance management.
Strengthen Infrastructure Monitoring Integration
Manage network and system incidents faster through unified observability.
Posts Related to This Service
Explore technical guides and decision-support content connected to this solution.
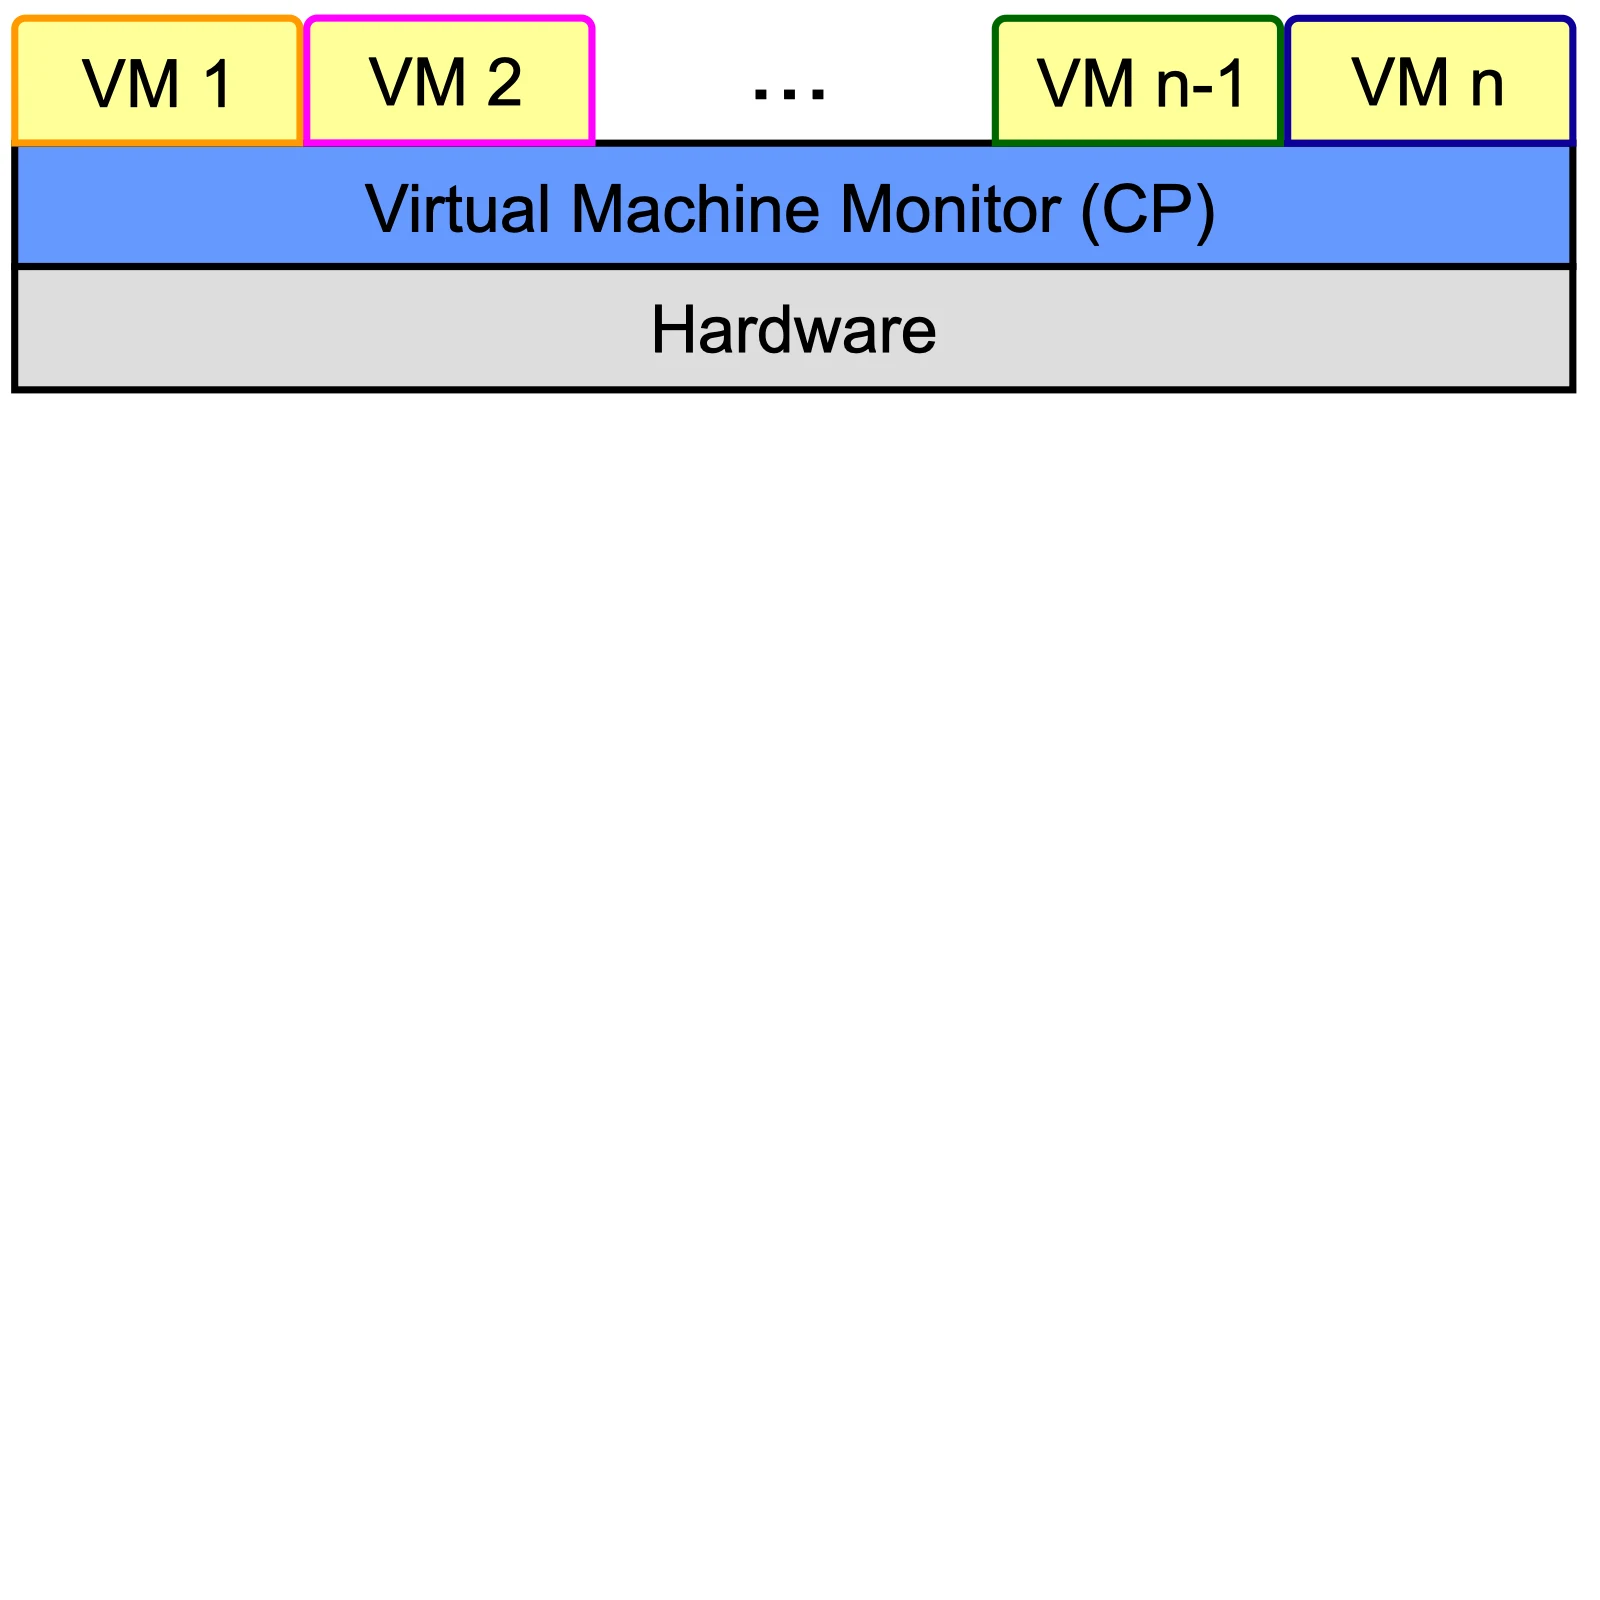
How to Implement VMware Monitoring for ISO 27001 (2026 Guide)
A March 31, 2026 guide to VMware monitoring for ISO 27001, covering vCenter alarms, ESXi remote syslog, centralized log analysis, and audit-ready evidence design.
Read Article
Common Mistakes in Designing 5651 Compliant Network Architecture
We examine the most common technical and architectural mistakes made when designing network infrastructure to ensure compliance with Law No. 5651, their cybersecurity risks, and correct solutions.
Read Article
ISO 27001 and Network Security: Firewall and VPN Requirements
We examine network security, firewall management, and VPN requirements within the scope of ISO 27001 Information Security Management System (ISMS) Annex A technological controls.
Read Article