
VMware vSAN performance optimization is not just about faster disks or clearing a few alerts. The real work is reading network design, storage policy, telemetry, and host layout together. The short answer is this: in the January 26, 2026 context, strong vSAN performance comes from enabling the right measurement layer first, then simplifying network design, understanding policy impact, and isolating whether the bottleneck lives at the host, disk-group, network, or workload level. This guide is written for teams that want more predictable vSAN performance.
Quick Summary
- vSAN Performance Service makes cluster behavior visible at host, disk, disk-group, and VM level.
- Broadcom documentation states that high-resolution metrics can be collected at
30-second intervals. - Official vSAN Ready Node guidance highlights
10 GbEfor hybrid and all-flash designs, and25/100 GbEfor all-NVMe designs. - Official VMware/Broadcom content treats Active/Standby teaming and traffic separation as meaningful design decisions, especially for ESA environments.
- VMware/Broadcom shared test results showing traffic separation in ESA with
up to 25%performance improvement under test conditions. - That is why optimization is not about a single magic setting. It is about measurement, network design, policy behavior, and workload shape together.
Table of Contents
- Why Should You Measure vSAN Performance First?
- What Bottleneck Layers Show Up Most Often?
- How Does Network Design Affect Performance?
- Why Do ESA and Storage Policy Matter So Much?
- A Practical First 30-Minute Optimization Flow
- Which Mistakes Usually Cost the Most Performance?
- Frequently Asked Questions
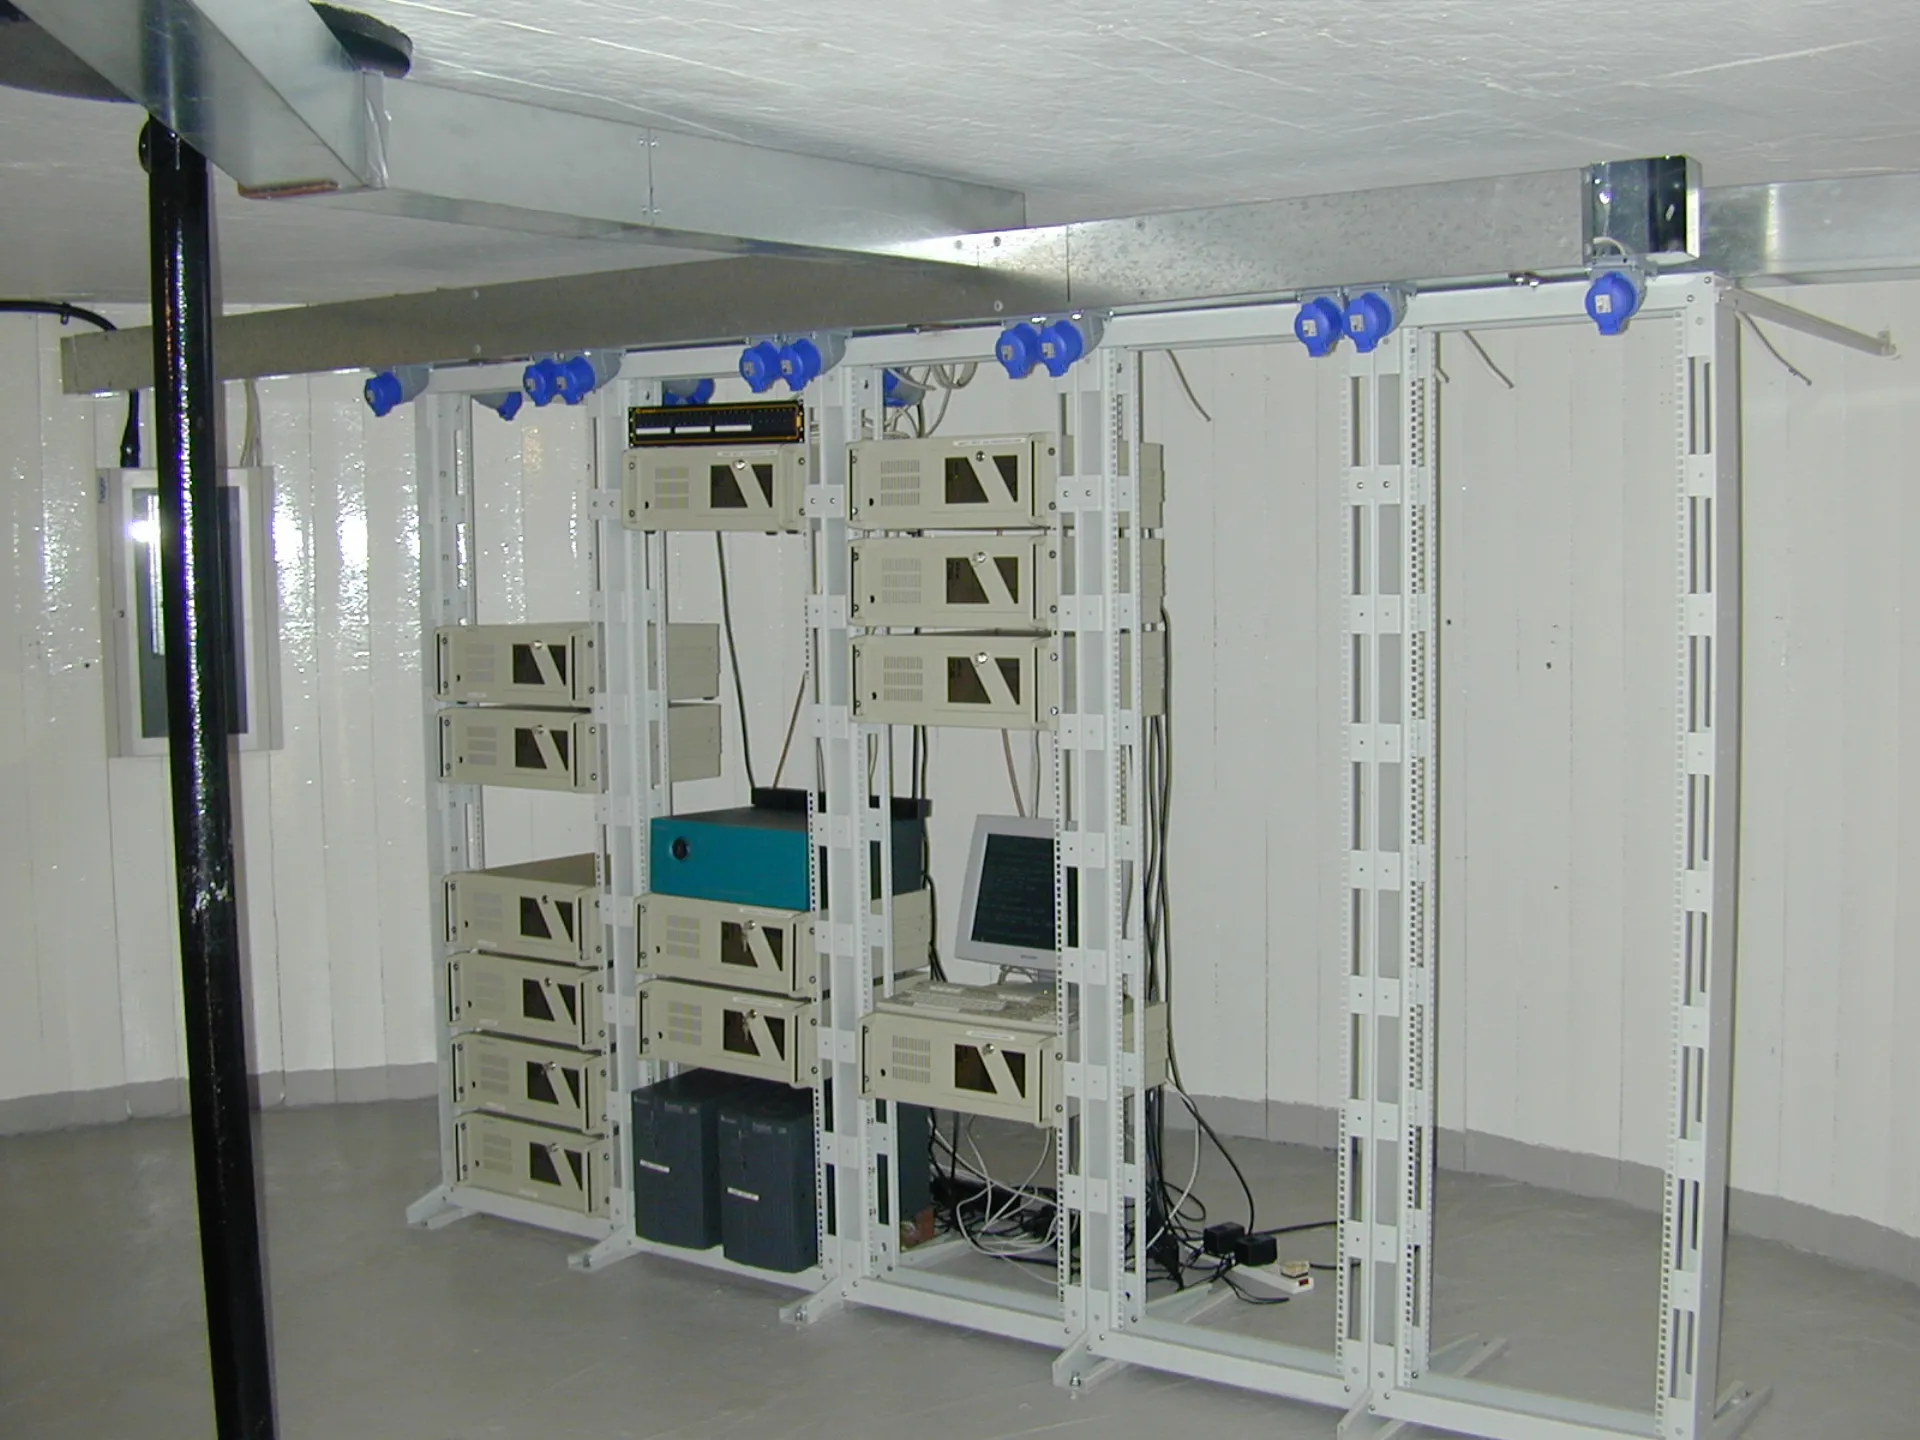
Image: Wikimedia Commons - Sealand-datacenter.
Why Should You Measure vSAN Performance First?
The most expensive optimization mistake is tuning before measuring. In vSAN, the same “it feels slow” complaint can come from four different places:
- workload behavior
- storage policy impact
- network transport design
- host or disk-group pressure
That is why the first step is to turn on the right visibility through vSAN Performance Service. Broadcom documentation describes high-resolution metrics with 30-second collection intervals. That detail matters because short spikes can disappear in coarse averages.
If a team only watches average latency, it can miss the real issue. Short peaks during backup windows, snapshot consolidation, bulk VM power-on events, or resync activity often explain what users actually experience.
What Bottleneck Layers Show Up Most Often?
In many environments, the bottleneck is described as “storage is slow,” but the real cause usually sits in a different layer.
1. Network layer
vSAN traffic needs predictable bandwidth and low latency. In all-NVMe and ESA environments especially, network design directly shapes performance behavior.
2. Policy layer
Two workloads in the same cluster can produce very different write behavior and usable capacity impact because they use different storage policies. That means performance data without policy context is incomplete.
3. Workload mix
Backup windows, clone bursts, synchronous replication behavior, or many VM power-on events at once can create noisy short-term contention.
4. Host balance
A cluster may look healthy in aggregate while some hosts run hotter than others. When imbalance sits at host or disk-group level, users still feel latency even when cluster averages look acceptable.
How Does Network Design Affect Performance?
Official vSAN Ready Node guidance treats networking as more than link speed. It is also about disciplined layout:
10 GbEis the baseline expectation in many hybrid and all-flash designs25 GbEor100 GbEbecomes the expectation for all-NVMe designs- the wrong teaming model can add packet reordering or unnecessary complexity
Official VMware/Broadcom blog content also emphasizes Active/Standby teaming for vSAN VMkernel design in many cases because “more active links” is not automatically a better outcome.
What does traffic separation change?
In VMware Cloud Foundation 9.0 era guidance, VMware/Broadcom reported up to 25% performance improvement in an ESA test scenario when traffic separation and DSE were applied. That does not mean every environment will reproduce the same number. The useful lesson is that mixed traffic patterns make storage behavior less predictable.
Why Do ESA and Storage Policy Matter So Much?
In ESA environments, performance discussions do not stop at disk count and network speed. Data path, compression behavior, placement behavior, and storage policy all need to be read together.
The most important lenses are:
- policy-driven protection behavior
- whether workloads are read-heavy or write-heavy
- cluster behavior under capacity pressure
- the impact of background resync work
One common mistake is saying, “the hardware is strong, so the application must be the problem.” In vSAN, policy has a real effect on how data behaves and how resources are consumed. That is why policy visibility is part of performance analysis, not a separate exercise.
A Practical First 30-Minute Optimization Flow
The highest-value initial flow usually looks like this:
- Open vSAN Performance Service views and compare host, VM, and disk-group behavior.
- Note the most obvious spike windows over the last
24hours. - Check whether backup, clone, snapshot consolidation, or patch windows overlap those spikes.
- Confirm whether vSAN VMkernel traffic is separated or mixed with other east-west traffic.
- Review uplink teaming design and challenge whether a more complex active/active layout is truly needed.
- List the storage policies used by the slowest workloads.
- Check whether rebuild or resync activity is present during the same performance window.
- For all-NVMe or ESA environments, confirm that network capacity aligns with the
25/100 GbEdesign expectation.
The goal is not to find a magic switch. It is to narrow the bottleneck to the right layer quickly.
Which Mistakes Usually Cost the Most Performance?
The most common vSAN performance losses come from:
- tuning without measurement
- ignoring storage policy impact
- mixing vSAN traffic with other heavy east-west traffic
- using an unsuitable uplink teaming model
- focusing only on IOPS while capacity pressure or resync load exists
- missing short spikes because the measurement window is too coarse
Another major mistake is trusting cluster-wide averages when only a subset of VMs feels slow. In vSAN, the important signal often appears inside specific workload groups rather than in global averages.
Next Step with LeonX
vSAN performance optimization is not a one-time tuning checklist. LeonX helps teams build a repeatable performance standard around traffic separation, storage policy validation, host balance, and telemetry-driven troubleshooting.
Related pages:
- Hardware & Software Sales
- Managed Services
- Contact
- What Is VMware vSAN?
- What Is VMware Storage Policy?
- VMware vSAN vs Traditional SAN Comparison
Frequently Asked Questions
Where should teams look first in VMware vSAN performance optimization?
They should first make sure the right performance data is visible. Tuning without vSAN Performance Service visibility is mostly guesswork.
Is 10 GbE enough for every vSAN environment?
No. Official Ready Node guidance points to 10 GbE for many hybrid and all-flash cases, while all-NVMe designs expect 25 GbE or 100 GbE.
Why is Active/Active teaming not always the right answer?
Because in some layouts it adds complexity and can create packet-ordering issues. Simpler designs can be more predictable.
Why does traffic separation matter in ESA?
Because official VMware/Broadcom test guidance reported meaningful gains with separated traffic. The lesson is not to chase one exact percentage, but to reduce contention noise.
Does storage policy really affect performance?
Yes. Policy is not only a protection setting. It also changes data behavior and resource consumption patterns.
Conclusion
VMware vSAN performance optimization is not just a search for faster disks. In the January 26, 2026 context, the stronger approach is to make measurement visible first and then read network, policy, host balance, and workload behavior together. The teams that get better results treat tuning as a structured diagnosis process, not as a random list of settings.


