How to analyze Dell storage latency means splitting delay into layers before blaming the array. Short answer: align application/host, fabric (FC/Ethernet), and storage (appliance/volume/file) metrics on the same time window; read latency with IOPS, bandwidth, and I/O size; then prove whether the bottleneck is host queue, network, or inside the array. On PowerStore, array latency is typically reported in microseconds (µs) at volume/appliance scope—not end-to-end host RTT. PowerStore emergency path: High Latency Guide. Optimization steps: Performance Optimize. Access model: SAN vs NAS.
This guide is written for:
- Storage/ops teams turning “latency is high” alerts into root-cause analysis
- Architects aligning host, switch, and array teams on one timeline
- Organizations standardizing analysis language across PowerStore / PowerMax / PowerScale
- IT leaders who want measurement before buying more capacity
Quick Summary
- Latency analysis = layer split (app → host → fabric → array → media), not one screen.
- Dell PowerStore: system metrics ~5 s, volume/file default ~20 s; retention 5s/20s → 1 hour, 5 min → 1 day, 1 hour → 30 days, 1 day → 2 years.
- Array latency in µs; host ESXi/guest in ms—do not mix units.
- Interpret latency + IOPS + bandwidth + avg I/O size together.
- Without top consumers / hot volumes, “everything is slow” is a weak claim.
- SAN (block) and NAS (file) measurement points differ — SAN vs NAS.
- Media/disk layer: Disk Types and Performance.
Table of Contents
- What Does Latency Measure?
- Layered Analysis Model
- Reading Metrics Together
- Practical Reading on PowerStore
- PowerMax and PowerScale Notes
- First 30-Minute Playbook
- Common Analysis Mistakes
- Checklist
- Next Step with Leon-X
- Frequently Asked Questions
- Sources
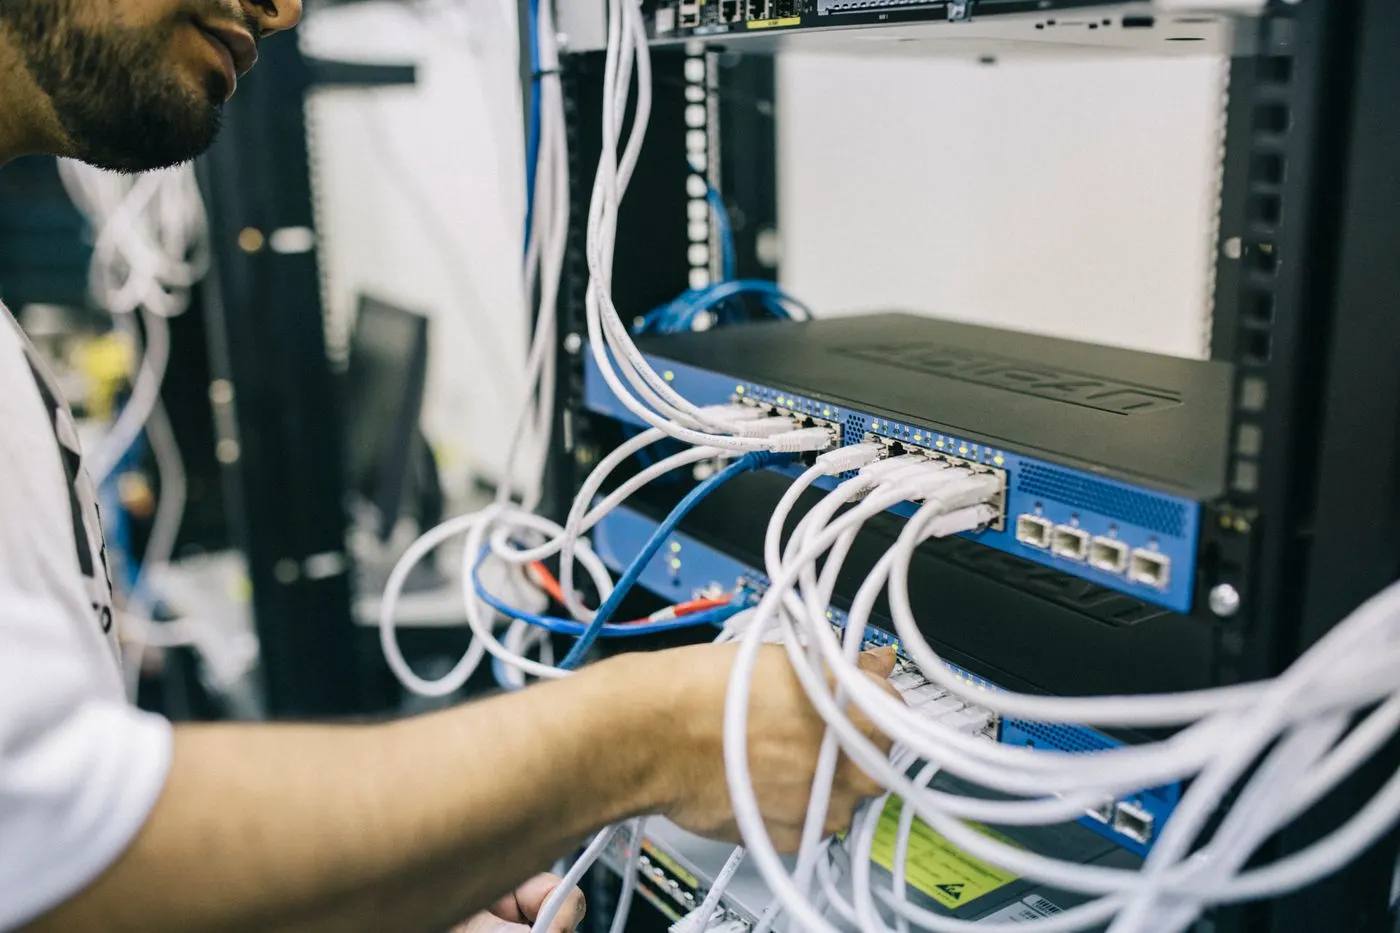
Image: Pexels - Data center / server room (storage infrastructure context).
What Does Latency Measure?
Storage latency is how long an I/O takes at a given measurement point. Critical split:
| Measurement | Typical unit | What it tells you |
|---|---|---|
| Guest / app | ms | App + OS + hypervisor + path |
| Hypervisor datastore | ms | Host stack + path + array |
| Array volume/appliance | µs (PowerStore) | Delay measurable inside the array |
| Port / fabric | µs–ms | Link, congestion, HBA queue |
Short definition: Dell storage latency analysis is proving the bottleneck by correlating host, fabric, and array metrics in the same time window.
Dell documentation emphasizes that PowerStore latency represents measurable appliance/node/volume delay—not full host end-to-end RTT. So “array 800 µs, guest 25 ms” is not inconsistent; they are different layers.
Layered Analysis Model
Application / Guest OS
        ↓
Hypervisor / Host (queue, multipath, HBA)
        ↓
Fabric (FC zoning / Ethernet congestion, CRC, pause)
        ↓
Array front-end (port, login, node)
        ↓
Array data path (volume, CPU, cache, DRE)
        ↓
Media (NVMe / SAS / HDD)
Decision rules:
- Array low, host high → host/path/queue or guest I/O pattern
- Array and host both rising → array hotspot, overload, or media
- Port errors / retransmits / CRC → fabric first
- Single volume/top consumer → focus there; do not blame “the whole array”
Reading Metrics Together
| Observation | Likely reading |
|---|---|
| Latency ↑, IOPS flat/down | Queueing, small random I/O, contention |
| Latency ↑, bandwidth ↑, large I/O size | Throughput saturation; port/link limit |
| Latency ↑ write-only | Cache/destage, replication, mirror path |
| Latency ↑ read-only | Cache miss, media, sequential vs random |
| Single host/volume spike | Top consumer; noisy neighbor |
Pro Tip: Single-threaded or copy-paste “benchmarks” do not represent real latency profiles; Dell Best Practices expect production-like parallel I/O.
Practical Reading on PowerStore
- Time align: Complaint moment ± same 5–20 s granularity window
- Appliance / node latency (µs) + volume top consumers
- Host metrics (PowerStore Manager / API
performance_metrics_by_host) - Port latency and link health (FC / iSCSI / NVMe/TCP)
- CPU / frontend pressure and capacity alarms
- If needed, REST
/metricswith Five_Sec / Twenty_Sec / Five_Mins (Info Hub Python examples)
Retention reminder: short intervals keep short history; miss “yesterday 14:03 spike” if you pick the wrong interval/retention.
Deeper remediation: Performance Optimize. Emergency high latency: High Latency Guide.
PowerMax and PowerScale Notes
| Platform | Analysis focus | Context |
|---|---|---|
| PowerMax | FE director, port, SRDF impact, service level | What is PowerMax |
| PowerStore | Appliance/volume µs, top consumers, host path | Steps above |
| PowerScale | Protocol latency, SmartConnect, front-end vs back-end, metadata | What is PowerScale · use cases |
On PowerScale, a “slow share” is often back-end fabric or metadata-heavy small-file patterns; there is no block volume latency screen—use NFS/SMB clients and OneFS performance tools.
First 30-Minute Playbook
- Record T0: time, app, datastore/volume/share, affected hosts
- Unit check: host ms vs array µs?
- Same-window charts: host + volume + port
- Top consumer: highest latency/IOPS object
- Fabric smoke: link down, CRC, congestion, single remaining path?
- Any change? firmware, path policy, QoS, replication, snapshot load
- Hypothesis + evidence: “array overload” only if array metrics rose
- Next step: optimize / capacity / fabric ticket—not guesswork
Common Analysis Mistakes
- Looking only at the array GUI and skipping the host
- Comparing µs to ms
- Missing the peak via wrong retention/interval
- Spreading a single-volume issue to the whole cluster
- Judging production SLAs with single-thread synthetic tests
- Mixing SAN vs NAS measurement points
- Calling cache/replication windows “slow disks” — Cache problem
Checklist
- T0 time and affected objects recorded.
- Host vs array units (ms/µs) clarified.
- Latency + IOPS + bandwidth + I/O size in one window.
- Top consumer / hotspot identified.
- Fabric (CRC, path, congestion) checked.
- Change / maintenance / replication / snapshot window asked.
- For PowerStore, 5s/20s retention difference known.
- SAN vs NAS measurement method chosen.
- Hypothesis matches evidence; capacity buy is last resort.
- Related optimize / high-latency guides reviewed.
Next Step with Leon-X
Leon-X runs latency analysis with host–fabric–array correlation and performance/capacity planning via Storage Capacity Planning and Performance Optimization. Discovery: Contact Us.
Frequently Asked Questions
Why is the app slow when array latency is low?
Because the app also includes host, guest FS, CPU steal, locks, or network delay. Low array µs can still mean high end-to-end ms.
What is a “good” latency threshold?
It depends on the workload. All-flash block often sits in hundreds of µs; 10+ ms guest latency alarms many OLTP apps. Write baselines against your own SLA.
Why is PowerStore latency in µs?
Dell PowerStore performance metrics report volume/appliance latency in microseconds; host tools usually use milliseconds.
How do you measure NAS latency?
Client mount side (nfsiostat, SMB client), OneFS/PowerScale performance views, and front-end ports—there is no block volume latency screen.
When do you upsize capacity / model?
When array CPU/frontend is saturated, top consumers cannot be spread, and host/fabric are clean—optimize first, then scale. See Performance Optimize.